
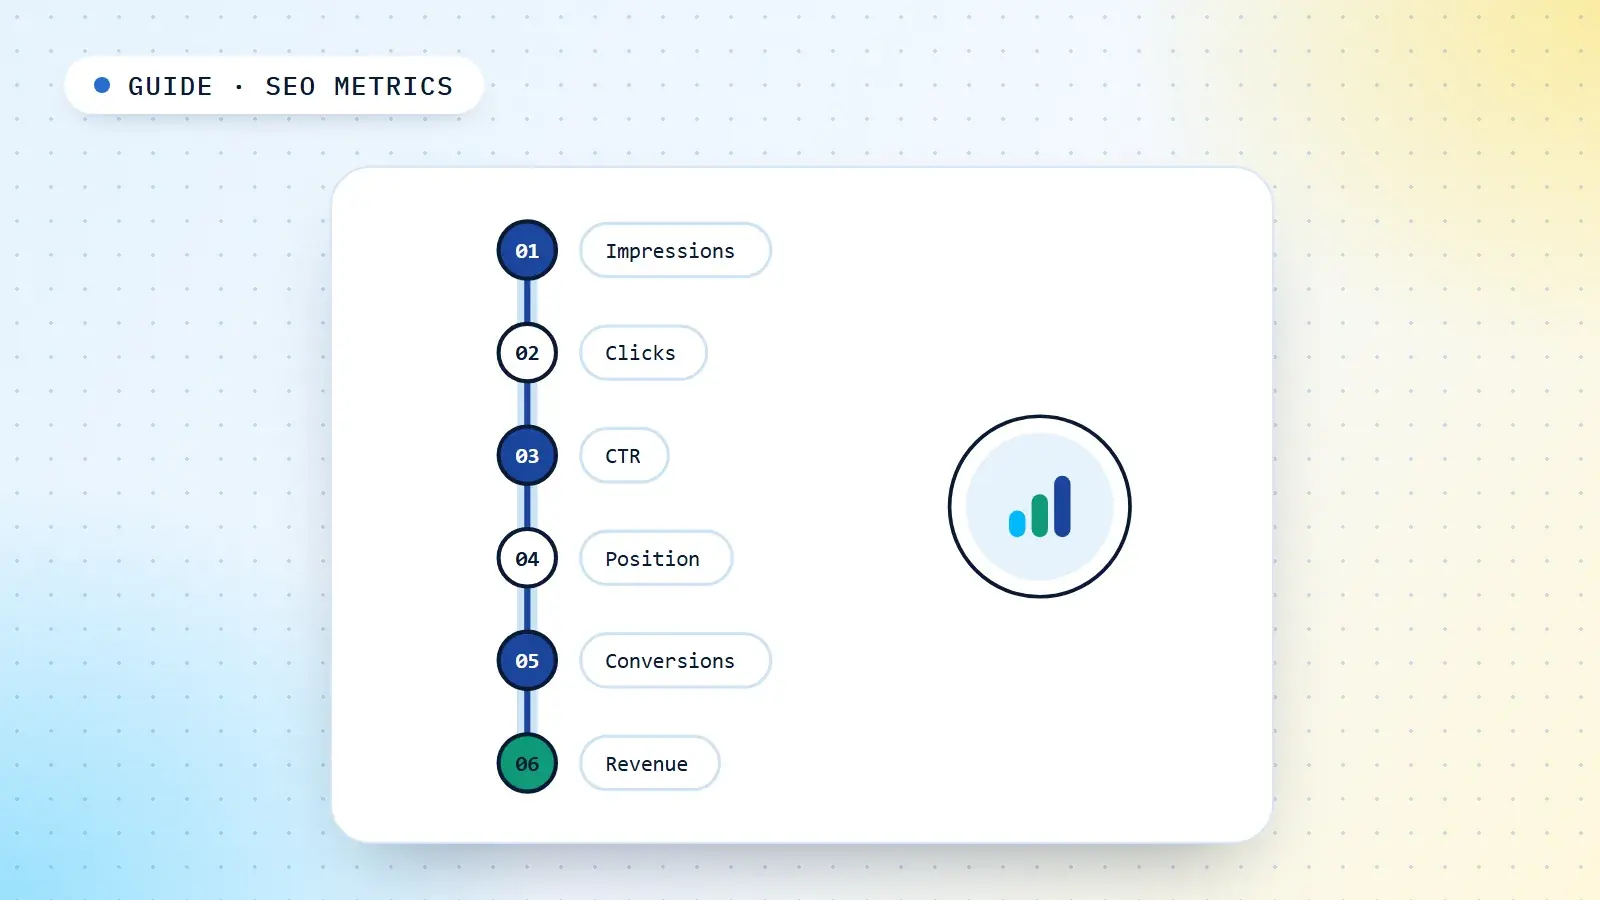
SEO metrics are the numbers that tell you whether search is working for a site: whether its pages are indexed and seen, whether people click, what they do after they arrive, and whether any of it turns into leads, sales or revenue. Most of them come from two free tools, Google Search Console and Google Analytics 4, plus your own CRM or sales data. Unfamiliar terms are defined in the SEO glossary.
The difficulty is not finding numbers. It is knowing what each one actually measures, where it misleads, and which ones belong in a report. This guide is the reference for that: the definitions as Google documents them, the traps in each, how to read the metrics together to diagnose a problem, and how to choose the few that matter for your kind of site.
What SEO metrics are for
Metrics do two different jobs, and mixing them up is the root of most bad SEO reporting.
- Outcome metrics tell you whether SEO is paying off: organic leads, sales, revenue, qualified pipeline. They move slowly and they are what the business cares about.
- Diagnostic metrics tell you why outcomes are moving, or are about to: indexed pages, impressions, clicks, click-through rate, position. They move fast and they are what you use to decide what to fix.
A useful way to hold them is as a stack, from the business result at the top to the technical foundations at the bottom. Each layer explains the one above it.
| Layer | Example metrics | Main source |
|---|---|---|
| Business outcome | Organic leads, sales, revenue, qualified pipeline | GA4 key events, CRM, ecommerce data |
| On-site behaviour | Organic sessions, engagement rate, conversion rate by landing page | GA4 |
| Search demand captured | Clicks, click-through rate, brand and non-brand clicks | Search Console |
| Search visibility | Impressions, average position, share of target queries you appear for, citations in AI answers | Search Console, rank tracker, manual checks |
| Foundations | Indexed pages, indexing issues, Core Web Vitals, crawl errors | Search Console |
Report from the top. Diagnose from the bottom. Why rankings belong near the bottom of that stack, not the top of a report, is the argument I make in rankings are not the goal.
Search Console metrics: impressions, clicks, CTR and position
Google Search Console's Performance report is the only first-party source of how your site appears in Google Search. It reports four metrics, and each has a precise definition that is easy to misread.
| Metric | What it counts | The trap |
|---|---|---|
| Impressions | How often a link to your site appeared in search results a user saw | An impression does not mean the result was looked at; a page-two listing or a link far down the page still counts once shown |
| Clicks | Clicks from Google Search results that took the user to your site | Will not match GA4 sessions; see below |
| CTR | Clicks divided by impressions | Meaningless across a whole site, because it mixes brand and non-brand queries and every position; compare it for one query or page type at a time |
| Average position | The average of the topmost position your site held, across the searches where it got an impression | Position is only recorded when there is an impression, so it is weighted towards the queries you already show for |
Average position deserves the most caution. Because it is only counted when you appear, a site that starts showing up on page three for hundreds of new queries will see its average position get worse, even though its visibility has improved. A site-wide average position is almost never worth reporting. Position for a specific query, or for a group of queries that share an intent, is useful.
Four other things Google documents about this data are worth knowing before you trust a number:
- Some queries are hidden. Queries Google treats as anonymised for privacy are left out of the query table but included in the chart totals, so the rows will not add up to the total. Expect the gap to be largest on long-tail and local queries.
- The data is not real time. Google says collected data is normally available in two to three days, and the most recent days are marked preliminary and can still change.
- AI features are blended in. Impressions and clicks from AI Overviews and AI Mode are reported within the "Web" search type, not as a separate line. You cannot isolate AI traffic in Search Console; the AI SEO guide covers what you can and cannot measure there.
- Property and page totals differ. The chart counts your site once per search, while the page table counts each URL that appeared, so the two views of the same period legitimately disagree.
Organic traffic in GA4
Search Console tells you what happened on Google's results page. Google Analytics 4 tells you what happened after the click, and it covers all search engines, not just Google.
Organic traffic in GA4 means sessions in the Organic Search default channel group. Google defines it as visits whose source matches its list of search sites, or whose medium is exactly "organic". Google's own description of the channel notes that it includes clicks from AI Overviews and AI Mode. Tag the links you share in emails, newsletters and social posts with UTM parameters, using the UTM builder, so that traffic is credited to the right channel instead of being mixed into direct or referral. The core metrics:
- Sessions and users from Organic Search, ideally broken down by landing page, because the landing page is where SEO work happens.
- Engaged sessions and engagement rate. GA4 counts a session as engaged if it lasts longer than ten seconds, includes a key event, or has two or more page or screen views. Engagement rate is the percentage of sessions that were engaged. It is a better quick signal of whether a page matched the searcher's intent than the old bounce rate.
- Key events. The actions you mark as important, such as a form submission, a call button tap, a purchase or a sign-up. These are what connect organic traffic to outcomes.
Why Search Console clicks and GA4 sessions never match
Every site owner notices this eventually. They measure different things in different ways. Search Console counts clicks on Google's side; GA4 counts sessions recorded by a script on your site. Visitors who decline analytics cookies, use ad or script blockers, or leave before the page loads never appear in GA4. One click can produce one session or several, and GA4 includes other search engines that Search Console does not. Use each tool for what it is good at, and compare trends, not absolute numbers.
Conversions and revenue
This is the layer that justifies the budget, and the one most often missing from SEO reports.
Start by defining what a conversion is for this business, then make sure it is tracked as a key event in GA4: a lead form, a demo request, a purchase, a booking. For many Indian businesses the most valuable action is not a form at all. It is a tap on a phone number or a WhatsApp button, and those taps need to be tracked as events too, or organic search will look far less valuable than it is.
Then measure at three levels:
- Organic conversions and conversion rate by landing page. This tells you which pages earn business and which earn only traffic.
- Lead quality. Where leads go into a CRM, tag the source and follow them through. An organic programme that sends fewer but better-qualified leads can be worth more than one that sends many.
- Revenue or pipeline. For ecommerce, revenue from organic sessions. For B2B and services, pipeline or closed revenue from organic-sourced leads, usually reported quarterly because sales cycles are long.
Organic search often starts a journey that ends in another channel, such as someone who reads a guide, leaves, and returns days later by typing the brand name. Last-click reporting gives that sale to "direct". Looking at the first landing page of converting users, and at brand search growth over time, helps show the contribution SEO actually made.
Indexing and technical health metrics
These do not belong in a monthly business report, but they are the first place to look when the numbers above fall unexpectedly.
- Indexed pages. Search Console's Page indexing report shows how many of your pages are indexed and not indexed, with the reason for each group. Track the count of important pages that are not indexed, not the total; some excluded URLs are excluded on purpose. The crawlability and indexability guide explains what each reason means.
- Core Web Vitals. The share of URLs rated good, needs improvement or poor for loading, responsiveness and visual stability, from real-user data. See the Core Web Vitals guide.
- Crawl and server errors. Spikes in server errors or a sudden drop in crawl requests often explain a later fall in impressions.
A healthy foundation is a condition, not a goal. Once the important pages are indexed and the templates pass, more technical work will not show up in these numbers, and they become a monitoring check rather than something to improve.
Visibility beyond your own site
Some of what SEO achieves never produces a session on your site, and some useful signals come from outside it.
- Share of target queries. Of the queries you have mapped to pages, how many does the site appear for at all, and how many on page one? This is a fairer visibility measure than a count of "keywords in the top ten", because it is limited to queries you decided matter. A keyword map provides the list.
- Rankings for priority queries. A rank tracker gives a daily, location-specific view that Search Console averages away. Use it as an early warning on the queries that drive revenue, not as the headline.
- Brand search. Impressions and clicks for branded queries over time are the best available proxy for whether people are hearing about you elsewhere, including in AI answers.
- Citations in AI answers. Whether your pages are cited for your key questions in AI Overviews, AI Mode and assistants can only be checked by sampling, and results vary between runs. Treat it as a trend, not a count.
- Authority. Referring domains that have organic visibility of their own, and links that reach the pages that need to rank. Third-party domain scores are estimates made by tool vendors, not Google metrics. The link building guide sets out the measures I use instead.
Reading metrics together
A single metric rarely tells you what happened. Two or three read together usually do. These are the patterns I see most often and where I look first.
| What you see | Likely causes | Where to look |
|---|---|---|
| Impressions up, clicks flat | New visibility for low-intent or low-position queries; or a new SERP feature, such as an AI Overview, taking the clicks | Queries that gained impressions; the live results for them |
| Clicks down, position stable | Seasonality, falling demand, or more of the results page taken by features and AI answers | Year-on-year comparison; impressions for the same queries; the live SERP |
| Position down on important queries | A competitor improved, a page changed, a core update reassessed quality, or the page lost internal links | Page change history; who now ranks above you and why |
| Impressions down sharply across the site | Indexing loss, a blocking robots.txt or noindex, a migration problem, or a manual action | Page indexing report; robots.txt; Manual actions report |
| GA4 organic down, Search Console clicks steady | Tracking: a broken tag, a consent change, a redirect stripping the referrer | Tag set-up; recent site or consent changes |
| Traffic steady, conversions down | A landing page or form changed, traffic shifted to less commercial queries, or tracking broke | Conversions by landing page; the query mix of those pages |
Always compare like with like. Week-on-week numbers in India swing with festivals, exam seasons, salary weeks and long weekends, so compare against the same period last year before concluding anything.
Choosing KPIs by site type
The right headline metrics depend on how the business makes money. Pick two or three outcome metrics and a handful of diagnostics; a report with thirty numbers is a report nobody reads.
| Site type | Outcome KPIs | Key diagnostics |
|---|---|---|
| Ecommerce | Organic revenue, orders, revenue by category page | Non-brand clicks to category and product pages, indexed product and category pages |
| SaaS | Organic sign-ups, trials or demo requests, and the pipeline they create | Clicks to product, comparison and use-case pages; brand search growth |
| Local business | Calls, direction requests, bookings, enquiries per location | Business Profile actions, local pack visibility, clicks to location pages |
| B2B services | Qualified leads and pipeline from organic | Clicks and conversion rate on service pages; non-brand impressions for service queries |
| Publisher | Engaged sessions, returning users, subscriptions or ad revenue | Clicks, Discover and News traffic where relevant, indexing speed for new articles |
Local businesses need more than Search Console and GA4, because much of their search activity happens in the Business Profile itself. The local SEO guide covers those measures. For SaaS, the SaaS SEO guide explains why signups, not traffic, should lead the report.
Building an SEO report
A good SEO report answers three questions: what happened, why, and what we are doing next. Numbers without the second and third parts are a data dump.
Lead with outcomes
Organic leads, sales or revenue for the period, against the same period last year and against the target.
Explain the movement
The two or three diagnostic metrics that explain the change, segmented: brand versus non-brand, and by page type or topic. One chart per point.
Show the work
What shipped in the period, with dates, so changes in the numbers can be connected to changes on the site. Annotate releases, migrations and algorithm updates on the charts.
Set the next actions
What will be done next and what result it should produce, so the next report can say whether it worked.
Cadence matters as much as content. I review diagnostics monthly and report outcomes quarterly, because content and authority work moves on a quarterly timescale and monthly outcome numbers mostly show noise. Measuring individual pages and topic clusters over time is covered in content SEO; how this fits into a wider plan is in the SEO strategy framework.
Metrics that mislead
Third-party authority scores
Domain authority, domain rating and similar scores are useful for comparing link profiles in one tool, but they are vendor estimates. Google does not use them. Raising one is not a goal.
Keyword counts in the top ten
A count of ranking keywords grows easily with irrelevant long-tail terms. It says nothing about whether the queries have value. Share of your own target queries is the honest version.
Site-wide average position
As explained above, it gets worse when visibility grows. Use position per query or per query group.
Total organic traffic
Traffic to an old blog post that ranks for something unrelated to the business inflates the total and dilutes every rate. Segment by page type and intent before reporting it.
Output metrics
Pages published, links built and tasks completed measure activity, not results. They belong in the "show the work" section, never in the headline.
Sources
Definitions of Search Console and Google Analytics metrics are from Google's own help documentation.
- Google Search Console Help: Performance report (Search results)
- Google Search Console Help: What are impressions, position, and clicks?
- Google Search Console Help: About Search Console data
- Google Search Central: A deep dive into Search Console performance data filtering and limits
- Google Search Console Help: Page indexing report
- Google Search Central: AI features and your website
- Google Analytics Help: Default channel group
- Google Analytics Help: Engagement rate and bounce rate
- Google Analytics Help: Key event
Frequently asked questions
What are the most important SEO metrics?
The ones closest to revenue: organic leads, sales or revenue, and conversion rate by landing page. Below those, non-brand clicks and impressions from Search Console explain why the outcomes are moving, and indexed pages and Core Web Vitals explain problems with the foundations.
What is a good click-through rate in SEO?
There is no single good CTR. It depends on position, the query, whether it is branded and how much of the results page is taken by ads, AI Overviews and other features. Compare CTR for the same query or page type over time, or against similar pages on your own site.
How do I measure organic traffic?
In Google Analytics 4, look at sessions in the Organic Search channel group, broken down by landing page. In Search Console, look at clicks in the Performance report. GA4 covers all search engines and what happens after the click; Search Console covers Google's results page only.
Why do Search Console clicks and GA4 sessions not match?
They measure different things. Search Console counts clicks on Google's side; GA4 counts sessions recorded on your site, which misses visitors who decline analytics cookies, block scripts or leave before the page loads. GA4 also includes other search engines. Compare trends, not totals.
Can I see AI Overview traffic in Search Console?
Not separately. Google reports impressions and clicks from AI Overviews and AI Mode within the Web search type in the Performance report, mixed with other results. You can track citations for important questions by checking them manually over time.
How often should I report on SEO?
Review diagnostic metrics such as clicks, impressions and indexing monthly, and report business outcomes quarterly. Content and authority work moves over months, so monthly outcome numbers are mostly noise. Always compare with the same period last year to remove seasonality.